Electronic signatures solved a visible problem – printing, scanning, and courier delays – but they quietly unlocked something far more valuable: data. Every signature event now produces a digital trail that can be measured, analyzed, and optimized.
Modern contract teams are no longer asking “Did it get signed?”
They’re asking:
- Why did it take this long?
- Where did deals stall?
- Which contracts never came back?
- How fast do different stakeholders sign?
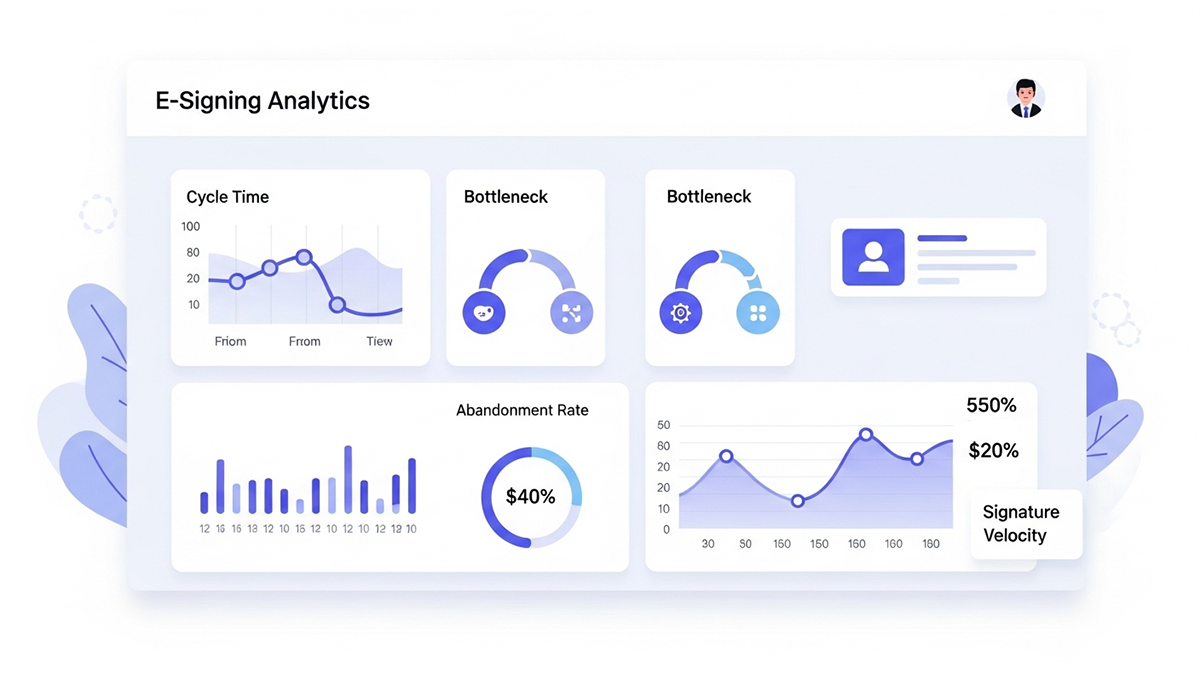
This is where e-signing analytics becomes a strategic asset. By measuring cycle time, bottlenecks, abandonment, and signature velocity, organizations gain real-time insight into how revenue, risk, and compliance actually move through the business.
This article breaks down each metric, how to measure it, what it reveals, and how leading teams use it to close deals faster, reduce friction, and create predictable execution.
1. Why E-Signing Analytics Matters More Than Ever
Digital transformation has moved contracts from static documents to living workflows. Every action-viewing, forwarding, signing, declining, or abandoning-is timestamped.
This data answers questions that were previously invisible:
- Why do enterprise contracts take 3× longer than SMB deals?
- Why does procurement always slow down in the final step?
- Why do NDAs sign quickly but MSAs stall?
- Which regions or roles consistently delay execution?
Without analytics, teams rely on anecdotes. With analytics, they operate on evidence.
E-signing analytics turns contract execution into a measurable, optimizable system, similar to how product teams analyze funnels or sales teams analyze pipelines.
2. Understanding E-Signing Cycle Time
What Is Cycle Time?
E-signing cycle time is the total duration from the moment a document is sent for signature to the moment the final signature is completed.
It typically includes:
- Document sent timestamp
- First open/view
- Intermediate signatures
- Final completion
Why Cycle Time Is Critical
Cycle time directly impacts:
- Revenue recognition
- Deal velocity
- Customer experience
- Operational efficiency
A contract that takes 45 days to sign doesn’t just delay revenue-it increases risk, negotiation fatigue, and the likelihood of abandonment.
How to Break Down Cycle Time
High-quality analytics break cycle time into stages:
- Send → First View
- First View → First Signature
- Inter-signer delays
- Final signature lag
This decomposition reveals whether the problem is:
- Awareness (not opening)
- Friction (hesitation to sign)
- Process (wrong signer order)
- Organizational delays
Actionable Insights from Cycle Time
- Identify contract types with abnormal delays
- Compare internal vs external signer behavior
- Detect regional or departmental slowdowns
- Forecast realistic close dates
Cycle time is the baseline metric-everything else builds on it.

Click to upload or drag & drop
pdf, docx up to 5 MB
Click to upload or drag & drop
pdf, docx up to 5 MB
3. Identifying Bottlenecks in the Signing Flow
What Are Signing Bottlenecks?
A bottleneck is a consistent delay point where documents pause longer than expected during the signing process.
Bottlenecks can be:
- A specific signer role (e.g., Legal, Finance)
- A signing order dependency
- A document type
- A geography or timezone
- A workflow rule (sequential vs parallel)
Common Bottleneck Patterns
- Executive Signature Delays
Documents wait days for leadership review despite minimal changes. - Sequential Signing Dependencies
One signer must act before others-even when parallel signing is possible. - Last-Signer Syndrome
The final signer delays because urgency feels lower. - External Counterparty Delays
Vendors or customers deprioritize contracts after negotiation ends.
How Analytics Surfaces Bottlenecks
Advanced analytics show:
- Average wait time per signer
- Median vs max delays
- Heatmaps by role or department
- Outliers vs normal behavior
Once visualized, bottlenecks stop being political and start being data-driven discussions.
Fixing Bottlenecks with Data
- Reorder signing sequences
- Introduce parallel signing where allowed
- Set automated nudges for high-delay roles
- Pre-approve standard clauses
- Assign backup signers
Bottlenecks are not failures-they’re signals.
4. Abandonment Analytics: The Silent Revenue Leak
What Is Contract Abandonment?
A contract is considered abandoned when it is:
- Sent for signature
- Viewed or partially signed
- Never completed within a defined time window
Unlike rejection, abandonment is silent-and dangerous.
Why Abandonment Matters
Abandoned contracts mean:
- Lost revenue
- Wasted negotiation effort
- Broken customer momentum
- Poor forecasting accuracy
Most teams don’t realize how many contracts die quietly.
Key Abandonment Metrics
- Abandonment rate by contract type
- Time-to-abandonment
- Drop-off stage (before or after first signature)
- Abandonment by signer role
- Abandonment by deal size
Common Causes of Abandonment
- Stakeholder turnover
- Legal fatigue
- Pricing confusion
- Missing urgency
- Poor follow-up
- Long gaps between actions
Using Analytics to Reduce Abandonment
- Trigger reminders based on inactivity patterns
- Escalate stalled documents automatically
- Re-engage deals before momentum fades
- Identify templates with high abandonment risk
Abandonment analytics converts “lost deals” into recoverable opportunities.
5. Signature Velocity: Measuring Speed Per Signer
What Is Signature Velocity?
Signature velocity measures how quickly a signer completes their action once the document reaches them.
Unlike cycle time, velocity is individual-centric.
Why Signature Velocity Is Powerful
It answers:
- Who signs quickly?
- Who consistently delays?
- Which roles are bottlenecks?
- How behavior changes by contract type
Velocity transforms opinions into performance metrics.
Velocity Metrics to Track
- Average time-to-sign per role
- Median vs worst-case signing time
- Velocity by department
- Velocity by external vs internal signers
- Velocity trends over time
Practical Use Cases
- Identify fast vs slow internal signers
- Improve executive signing workflows
- Adjust SLAs for approvals
- Design role-specific nudges
- Build predictive close models
Signature velocity brings human behavior into measurable focus.
6. Cross-Metric Intelligence: Seeing the Full Picture
The real power of e-signing analytics emerges when metrics are combined.
Example Correlations
- High cycle time + low abandonment → complex but committed deals
- Low cycle time + high abandonment → rushed but unclear agreements
- Slow velocity at last signer → missing urgency
- Bottlenecks + abandonment → process failure, not deal failure
Predictive Insights
By combining:
- Cycle time trends
- Bottleneck locations
- Abandonment probability
- Velocity patterns
Teams can predict outcomes before they happen.
This shifts contract execution from reactive to proactive.
7. Real-Time vs Historical Analytics
Historical Analytics
Used for:
- Quarterly reviews
- Process optimization
- Template redesign
- Policy changes
Real-Time Analytics
Used for:
- Deal rescue
- Escalation
- Follow-ups
- Executive visibility
Best-in-class systems support both.
8. Turning Insights into Automation
Analytics without action is reporting.
Analytics with automation is leverage.
Examples:
- Auto-remind based on velocity thresholds
- Escalate stalled contracts after X days
- Switch signing order dynamically
- Alert sales when abandonment risk spikes
- Trigger CRM updates on signature milestones
This is where e-signing analytics becomes operational intelligence.
9. Organizational Impact of E-Signing Analytics
Sales Teams
- Faster closes
- Better forecasting
- Fewer lost deals
Legal Teams
- Reduced review fatigue
- Standardized turnaround times
- Data-backed policy decisions
Finance Teams
- Faster revenue recognition
- Improved cash flow visibility
Leadership
- Clear execution metrics
- Bottleneck accountability
- Predictable operations
10. The Future of E-Signing Analytics
The next evolution includes:
- AI-driven delay predictions
- Behavioral risk scoring
- Clause-level velocity analysis
- Personalized signing experiences
- Autonomous contract execution workflows
E-signing analytics will move from measurement to decision-making.
Conclusion
E-signing is no longer just about capturing signatures-it’s about understanding how agreements move through an organization.
By mastering:
- Cycle Time
- Bottlenecks
- Abandonment
- Signature Velocity
Teams transform contract execution into a strategic advantage.
The organizations that win are not the ones that sign faster by chance-but the ones that engineer speed with data.
Read our complete guide on Contract Lifecycle Management.
FAQs
What is e-signing analytics?
E-signing analytics refers to the measurement and analysis of digital signature workflows, including timing, delays, signer behavior, and completion outcomes.
How is cycle time different from signature velocity?
Cycle time measures the entire signing process end-to-end, while signature velocity measures how fast an individual signer completes their action.
What causes high contract abandonment?
Common causes include long delays, unclear terms, lack of urgency, stakeholder changes, and poor follow-up.
Can e-signing analytics improve deal closure rates?
Yes. By identifying delays and abandonment risks early, teams can intervene before deals stall or collapse.
How do bottlenecks differ from delays?
Bottlenecks are systematic delays that occur consistently at the same stage or role, whereas delays can be one-off events.
Are these analytics useful for internal approvals?
Absolutely. Internal approvals often account for the largest hidden delays in contract execution.
How often should teams review e-signing analytics?
Real-time monitoring should be continuous, while deeper analysis should occur monthly or quarterly.
Can analytics predict whether a contract will be signed?
Advanced models can estimate signing probability based on velocity, inactivity, and historical patterns.
Do analytics replace human judgment?
No. They augment decision-making by providing objective insights into execution behavior.
What’s the biggest mistake teams make with e-signing data?
Collecting data without acting on it. Analytics only create value when they drive process change or automation.
Live in your environment.